

The State of L1s: Key Trends & Metrics
The State of L1s: Key Trends & Metrics
Since the start of the year, the L1 dominance map has evolved. This publication highlights the key changes in L1 metrics mindshare and previews upcoming releases.

How many L1 chains are there?
Already hundreds.
Coinmarketcap tracks 124 L1 tokens, not including those yet to undergo TGE. In this research, I will guide you through the metrics of the largest L1s from Q1 to Q3, highlight leadership changes, and explain the growth catalysts.
Fully Diluted Valuation
Throughout the year, Bitcoin's dominance in the L1 FDV landscape has grown steadily. At the start of the year, it accounted for 60% of the L1 FDV, but by the end of Q3, its dominance has exceeded 66%. As Bitcoin's influence increased, Ethereum's FDV share steadily declined, dropping from 19% in Q1 to 15.5% now.
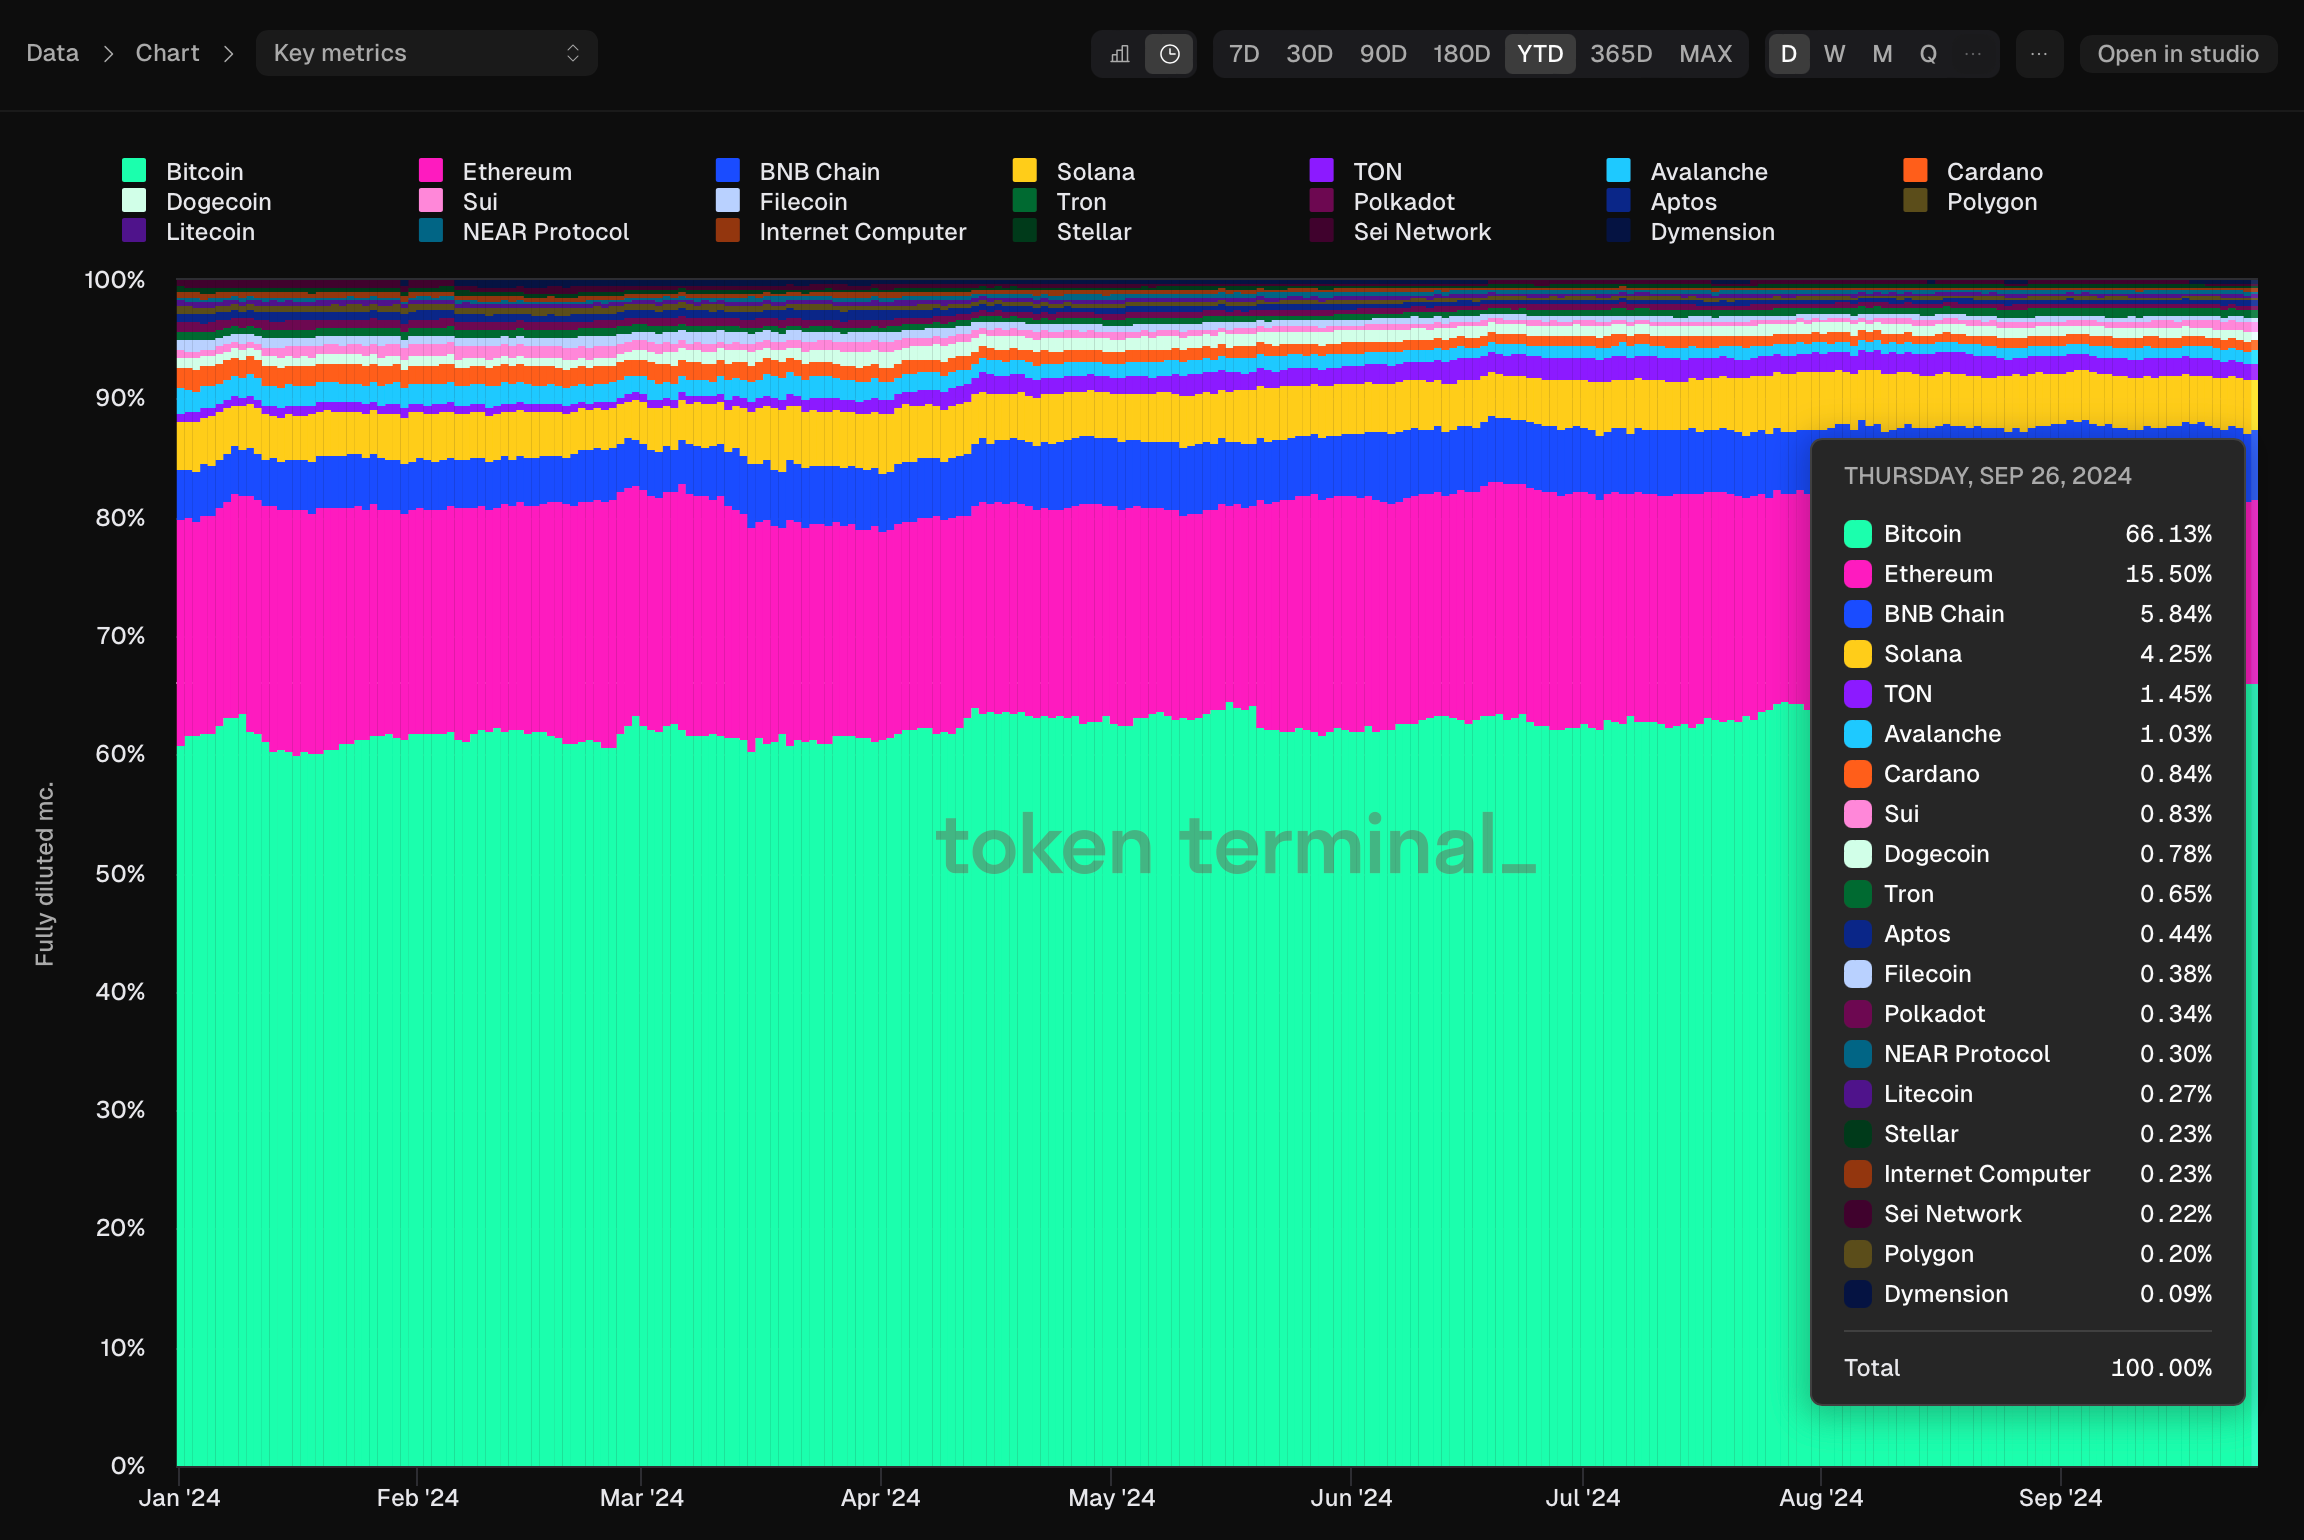
This was not the only change in the market share:
TON's dominance increased from 0.81% to 1.45%, making it the 5th largest L1 by FDV.
Sui rose from 0.52% to 0.83%, now in the 8th position.
Filecoin decreased from 0.92% to 0.38%.
Dymension entered the top 20, now accounting for 0.09%.
Sui's FDV fell by 57.1% in Q2, but grew by 86.6% in the following quarter. Grayscale launched investment trusts for Sui and Bittensor in mid-August, so the price of SUI could have risen.
Quick insight: The total circulating market cap for 56 L1 chains tracked on Token Terminal is $1.87 trillion, while the total FDV is $2.01 trillion. This indicates that $86 billion in value is yet to enter the market through new token unlocks.
Monthly Active Users
As the quarter draws to a close, the MAU chart shows increased concentration, with Solana now accounting for 56% of the top 20 L1s. This surge has been primarily driven by the memecoin frenzy, which began to cool down towards the end of Q3.
Similarly, MAUs have seen substantial growth on TON, rising from 0.39% at the start of the year to 7.31% now, making TON the third-ranked chain by MAUs on the list.
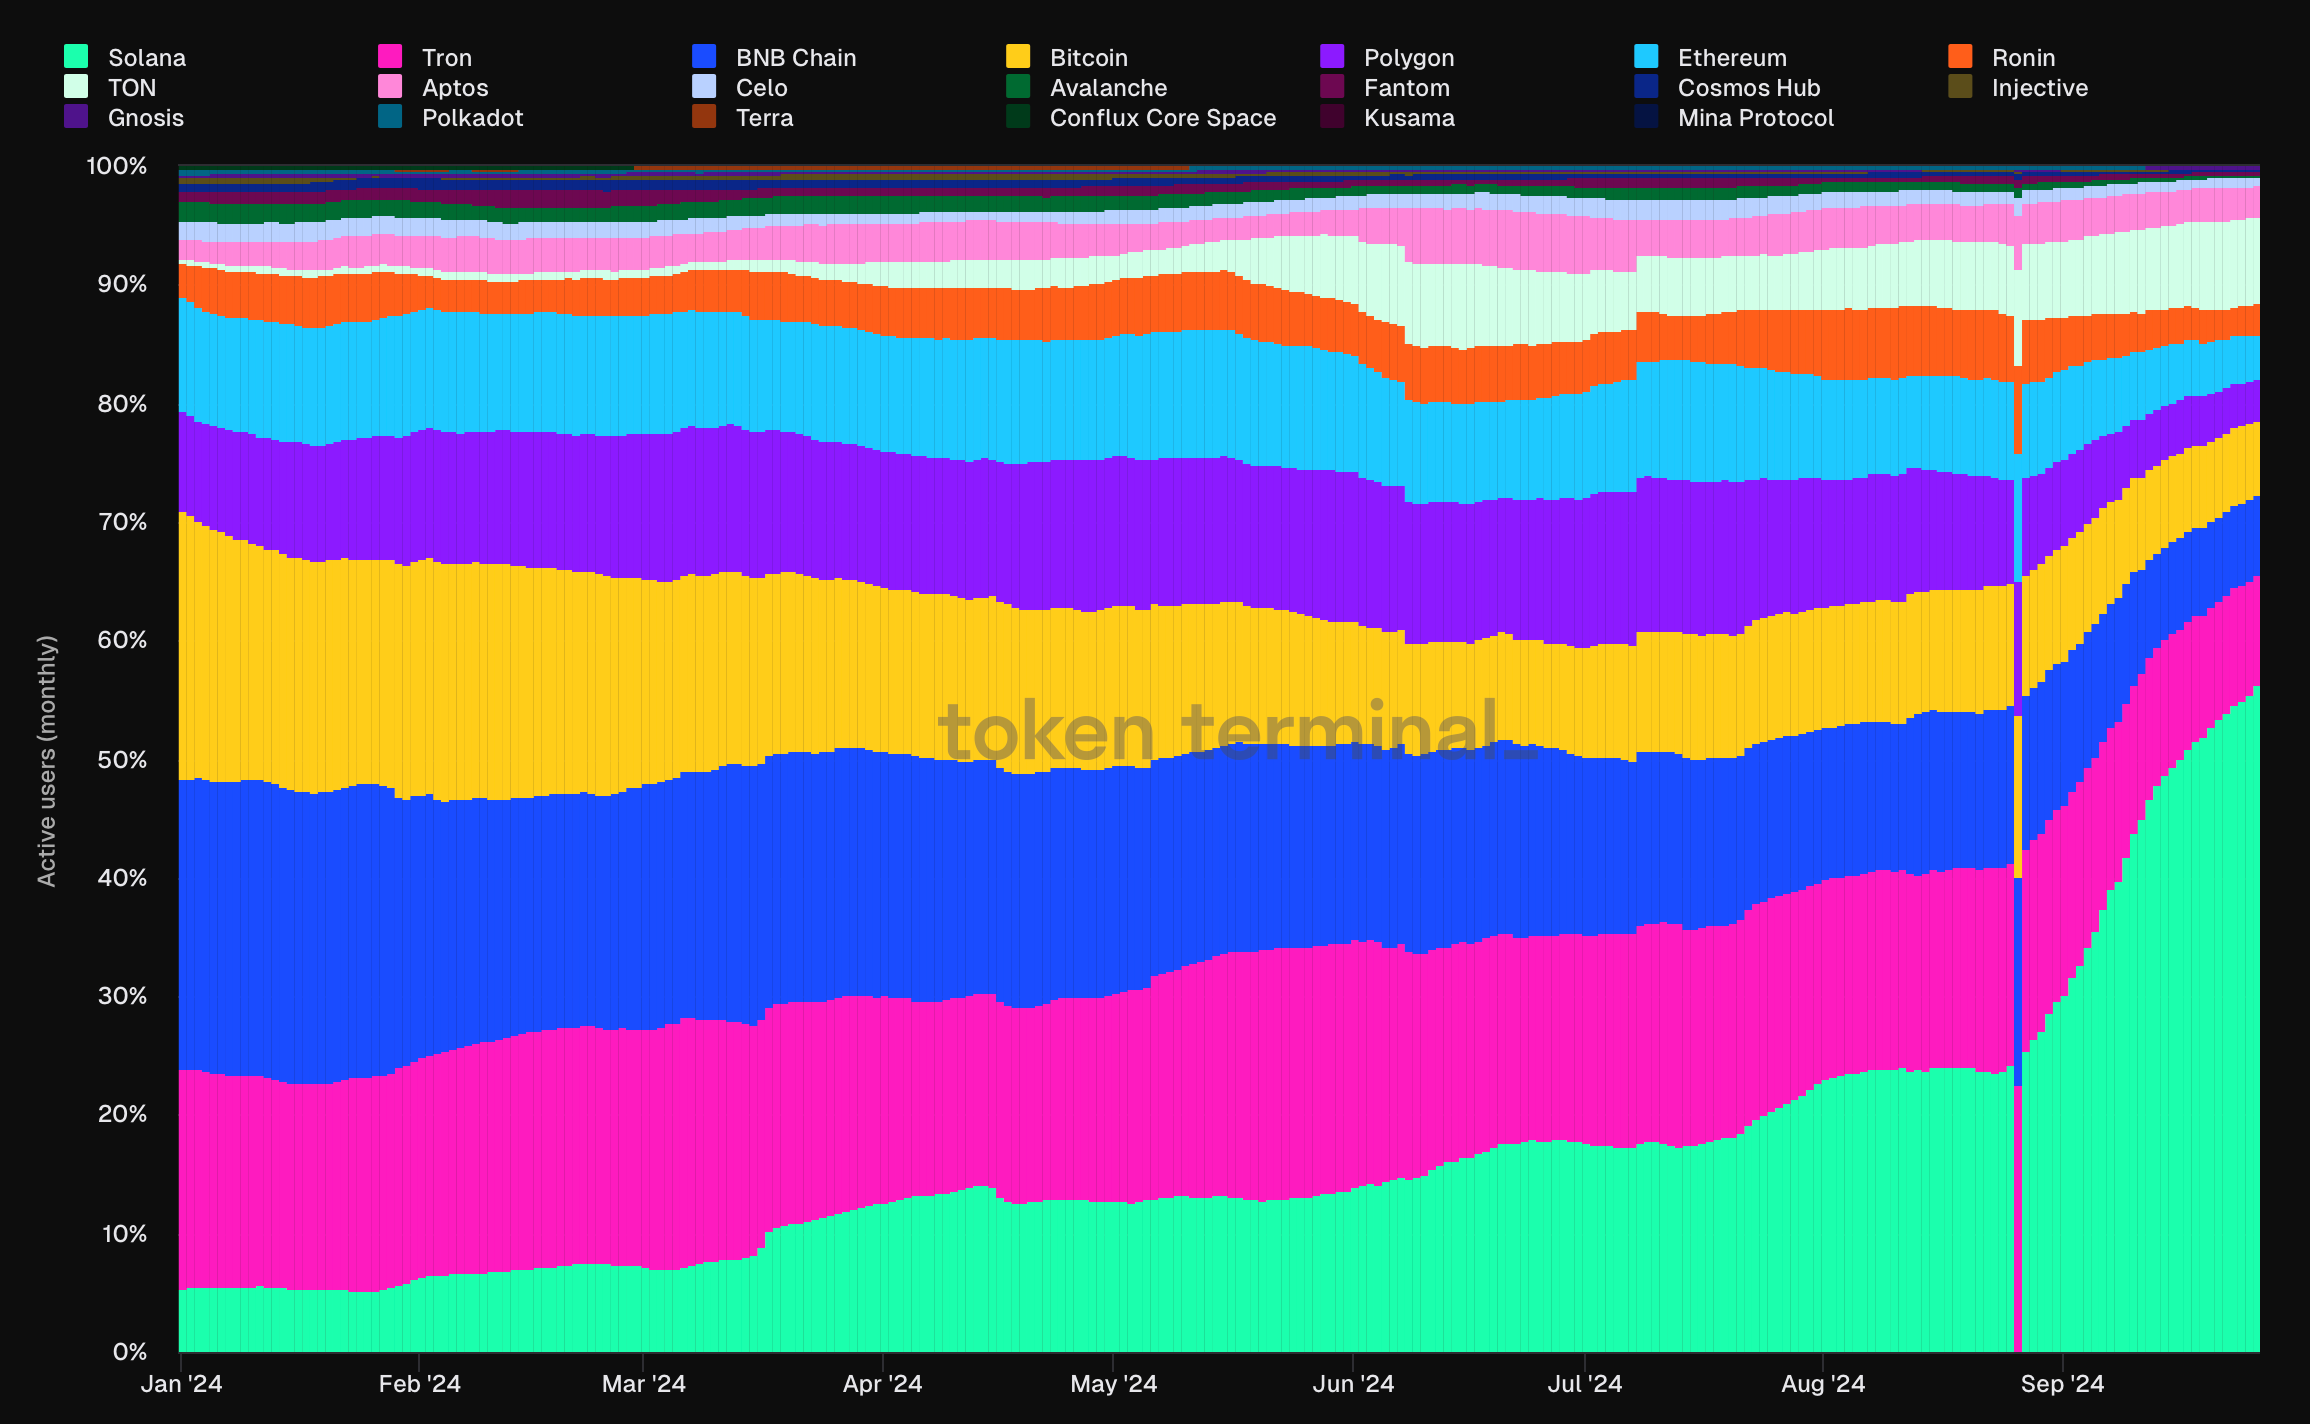
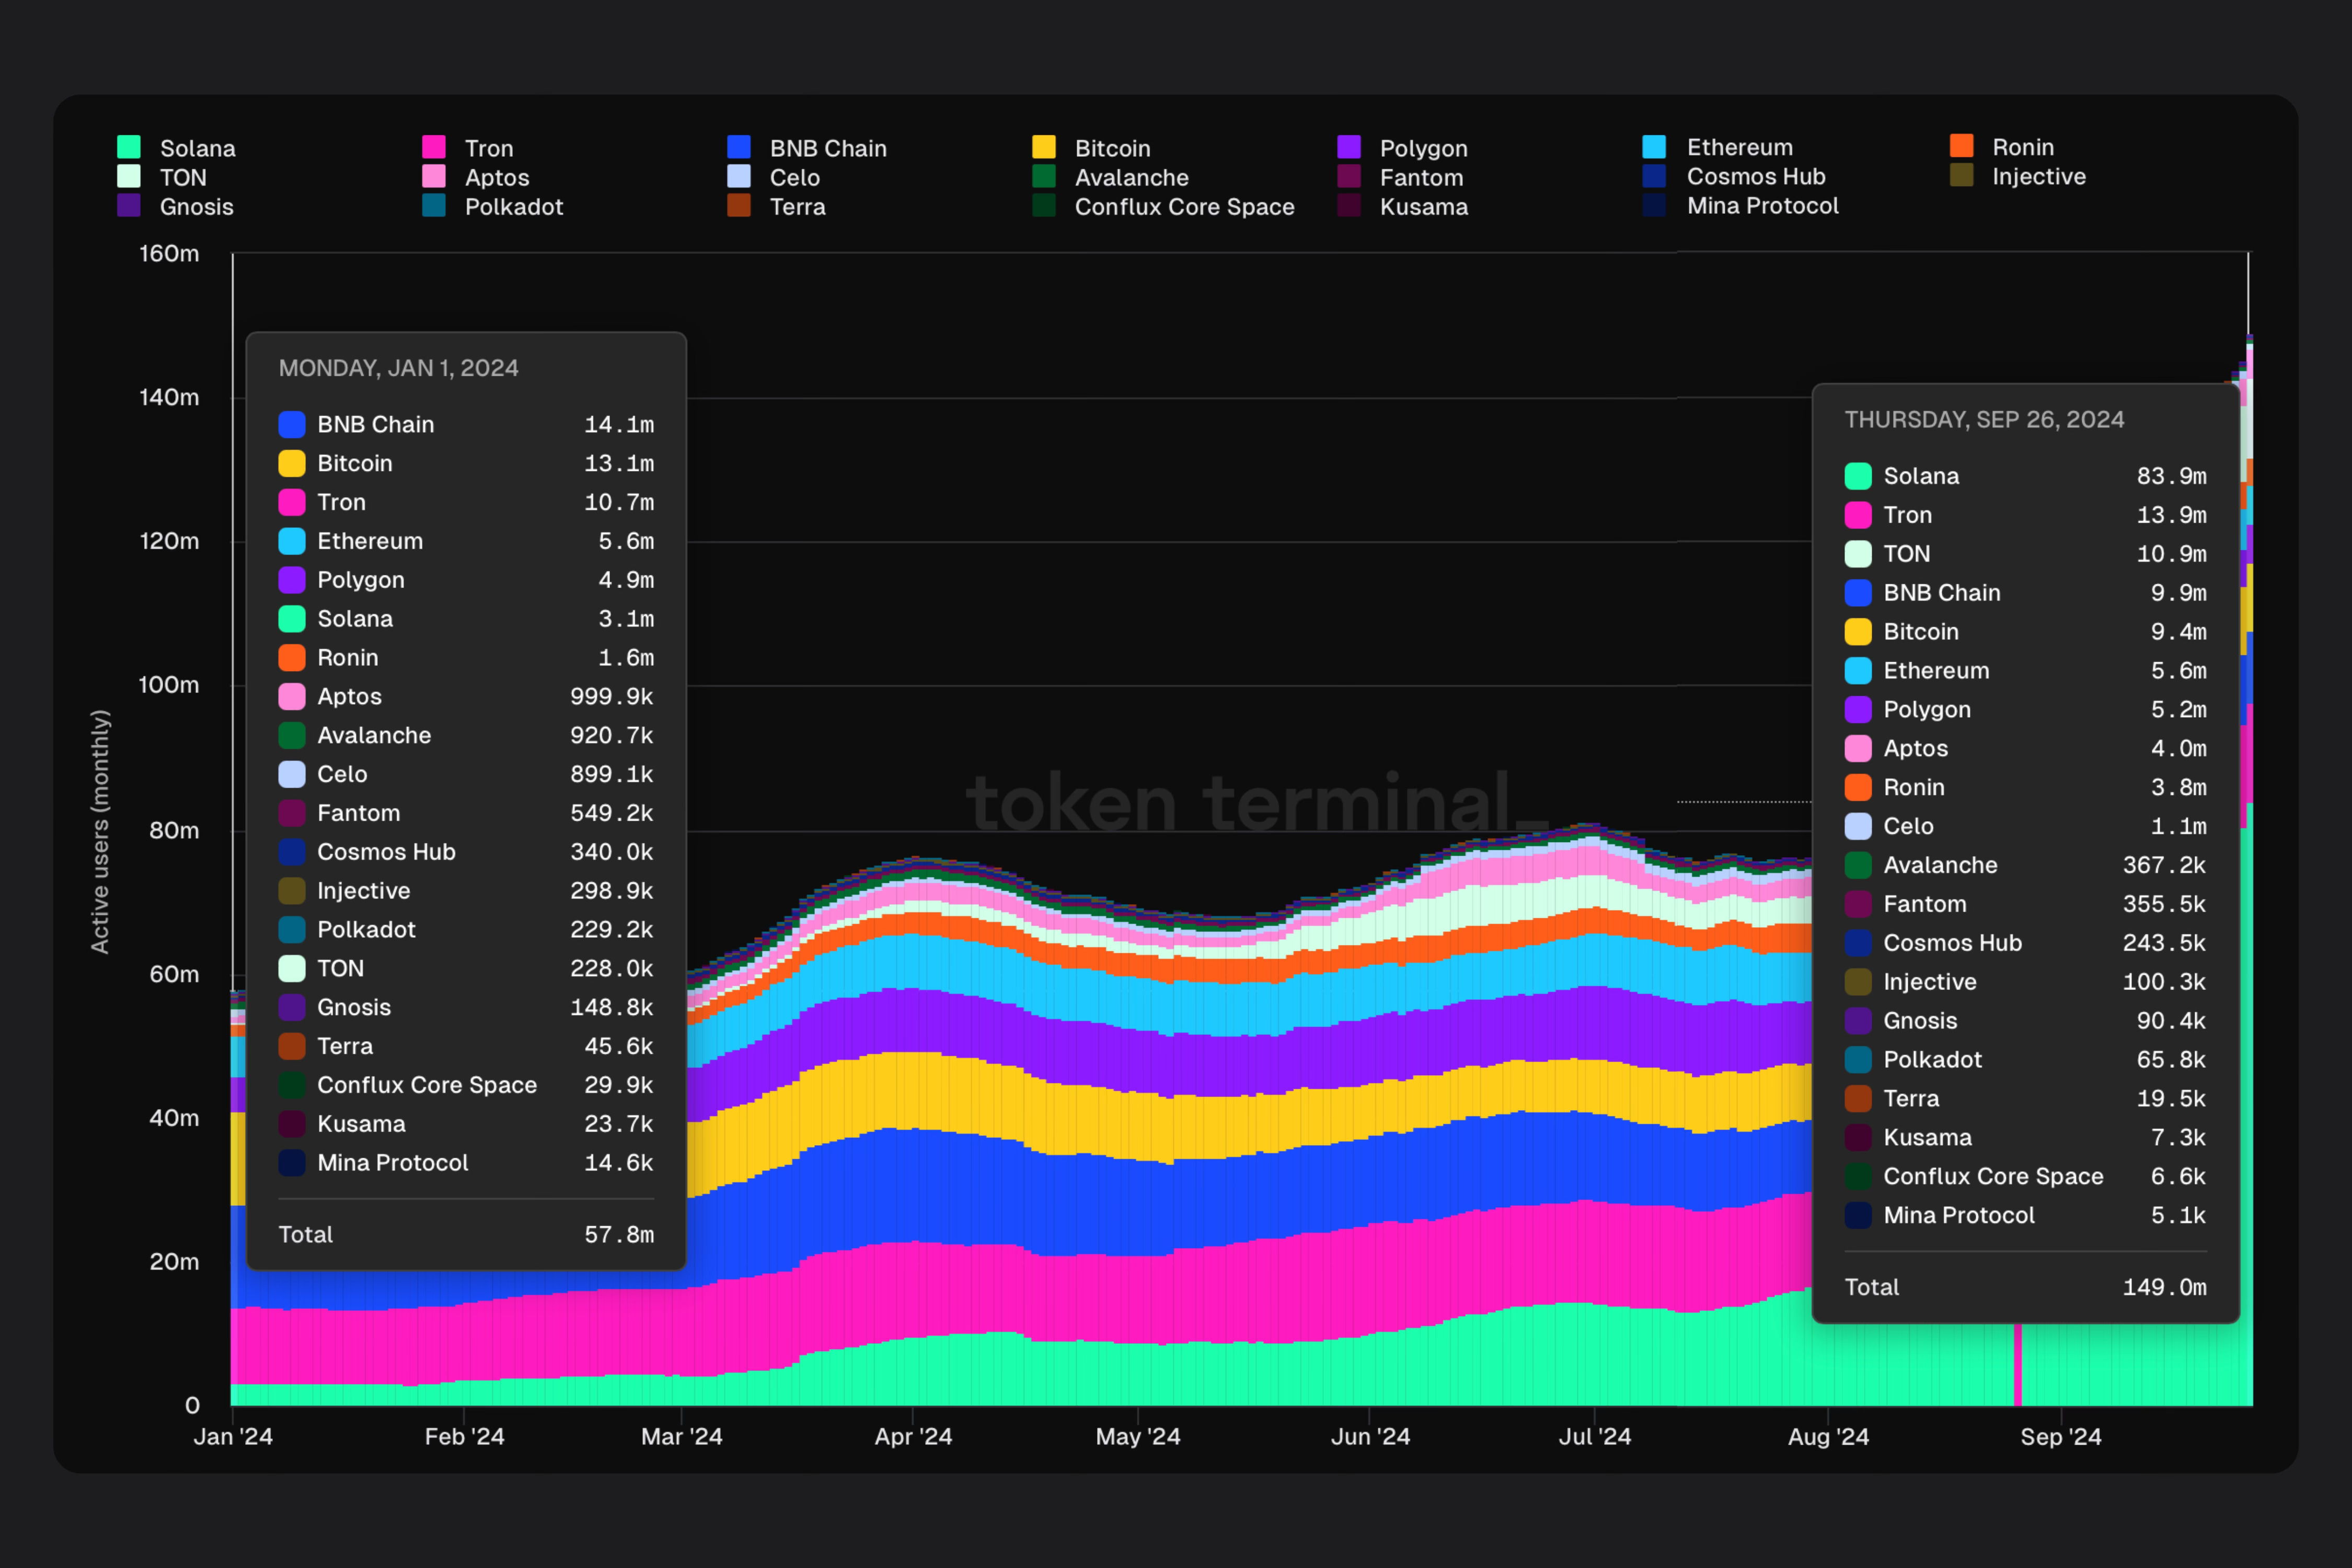
The number of active users on Layer 1 networks has surged from 57 million at the start of the year to 149 million now.
Here’re some highlights:
Solana: +79.9M MAUs
TON: +10.6M MAUs
Tron: +3.2M MAUs
Aptos: +3M MAUs
Ronin: +2.2M MAUs
Ethereum: no change
Bitcoin: -3.7M MAUs
BNB Chain: -4.2M MAUs
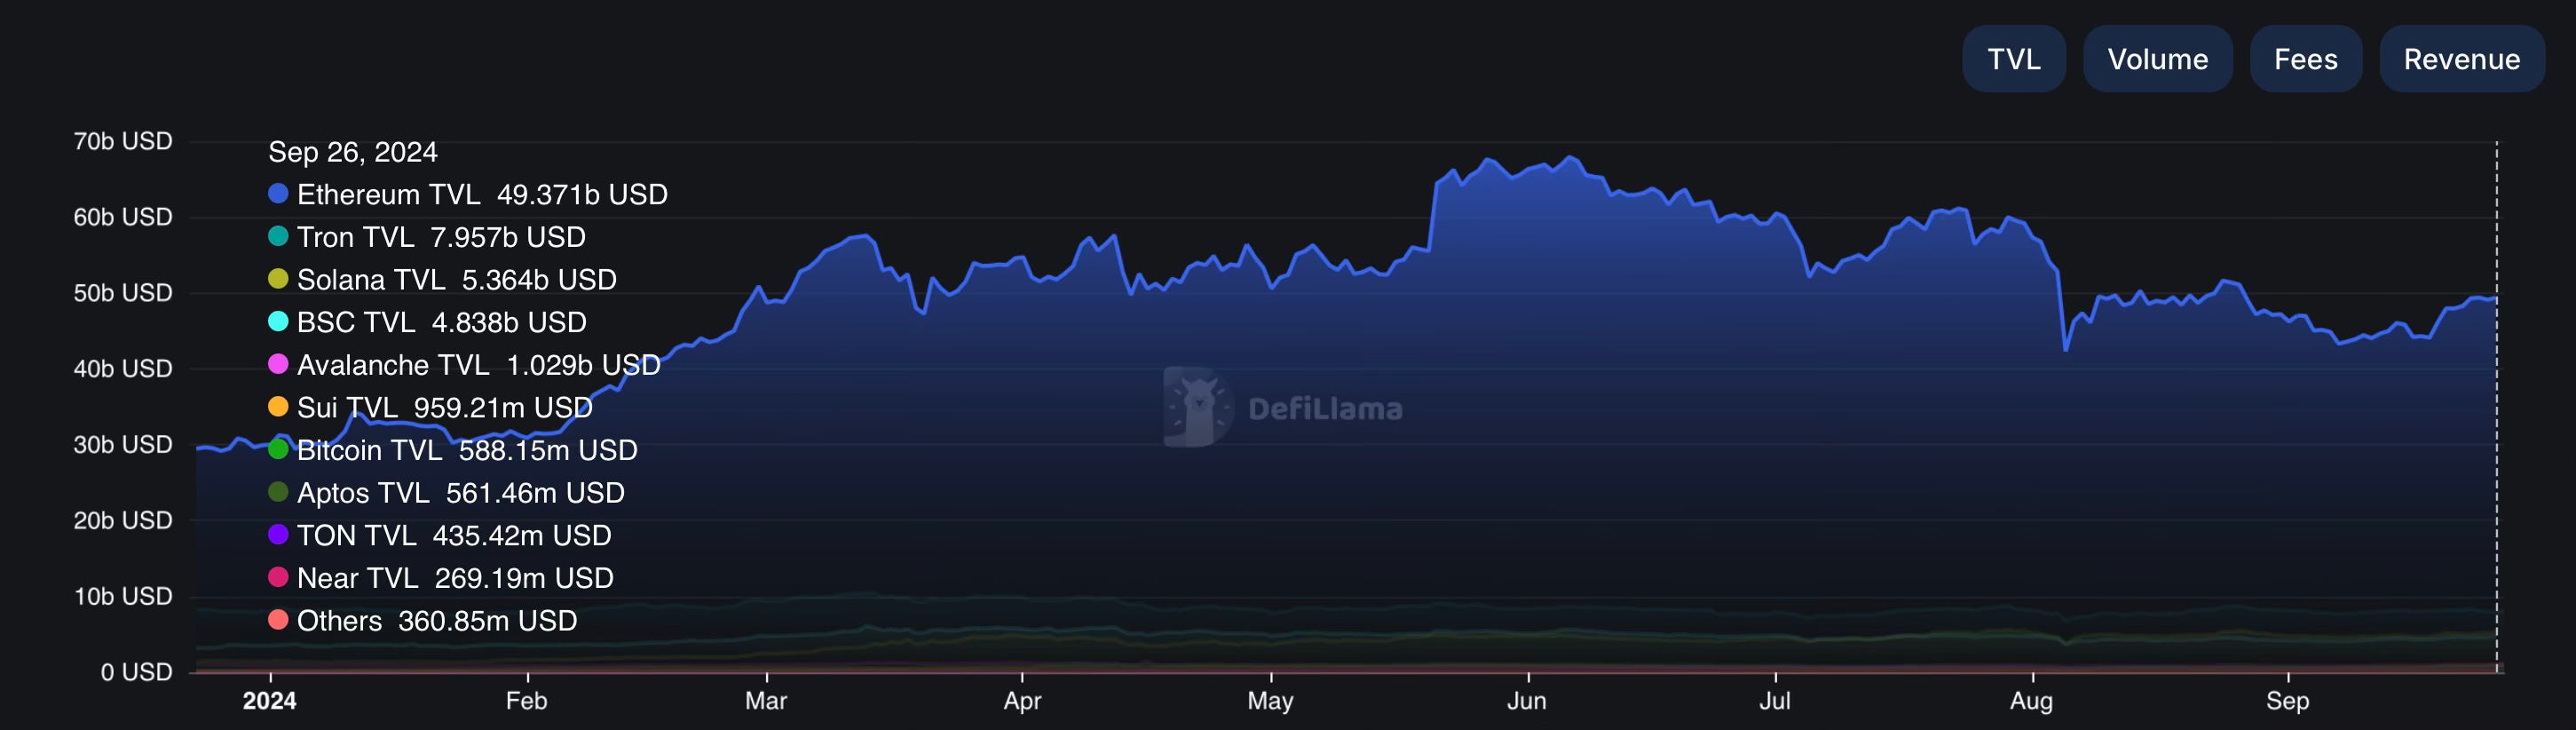
TVL
Bitcoin and TON showed a noticeable increase in TVL in Q3 2024. During this period, the halving occurred, and interest in Ordinals remained. In Q3, Bitcoin's TVL decreased by 35.6% amid falling investor sentiment and the stock market crash in August 2024. TON's TVL increased 6 times compared to Q1 2024.
Avalanche and Cardano experienced a TVL drop of more than 40% in Q2. Interest in Cardano decreased amid the growth of other blockchains, so the ecosystem as a whole experienced a decline in many indicators. Avalanche was of more interest to developers than investors, so its market indicators are lower than technical ones.
Revenue
On the revenue side, we’re seeing significant changes due to the post-Dencun fee impact and increased activity on Solana and Tron. Following Dencun, the Ethereum ultrasound money thesis has clearly collapsed, and in late August, Ethereum's revenue share dropped below 5%.
Meanwhile, Tron's revenue from fees is steadily rising, recently averaging $6 million per day.
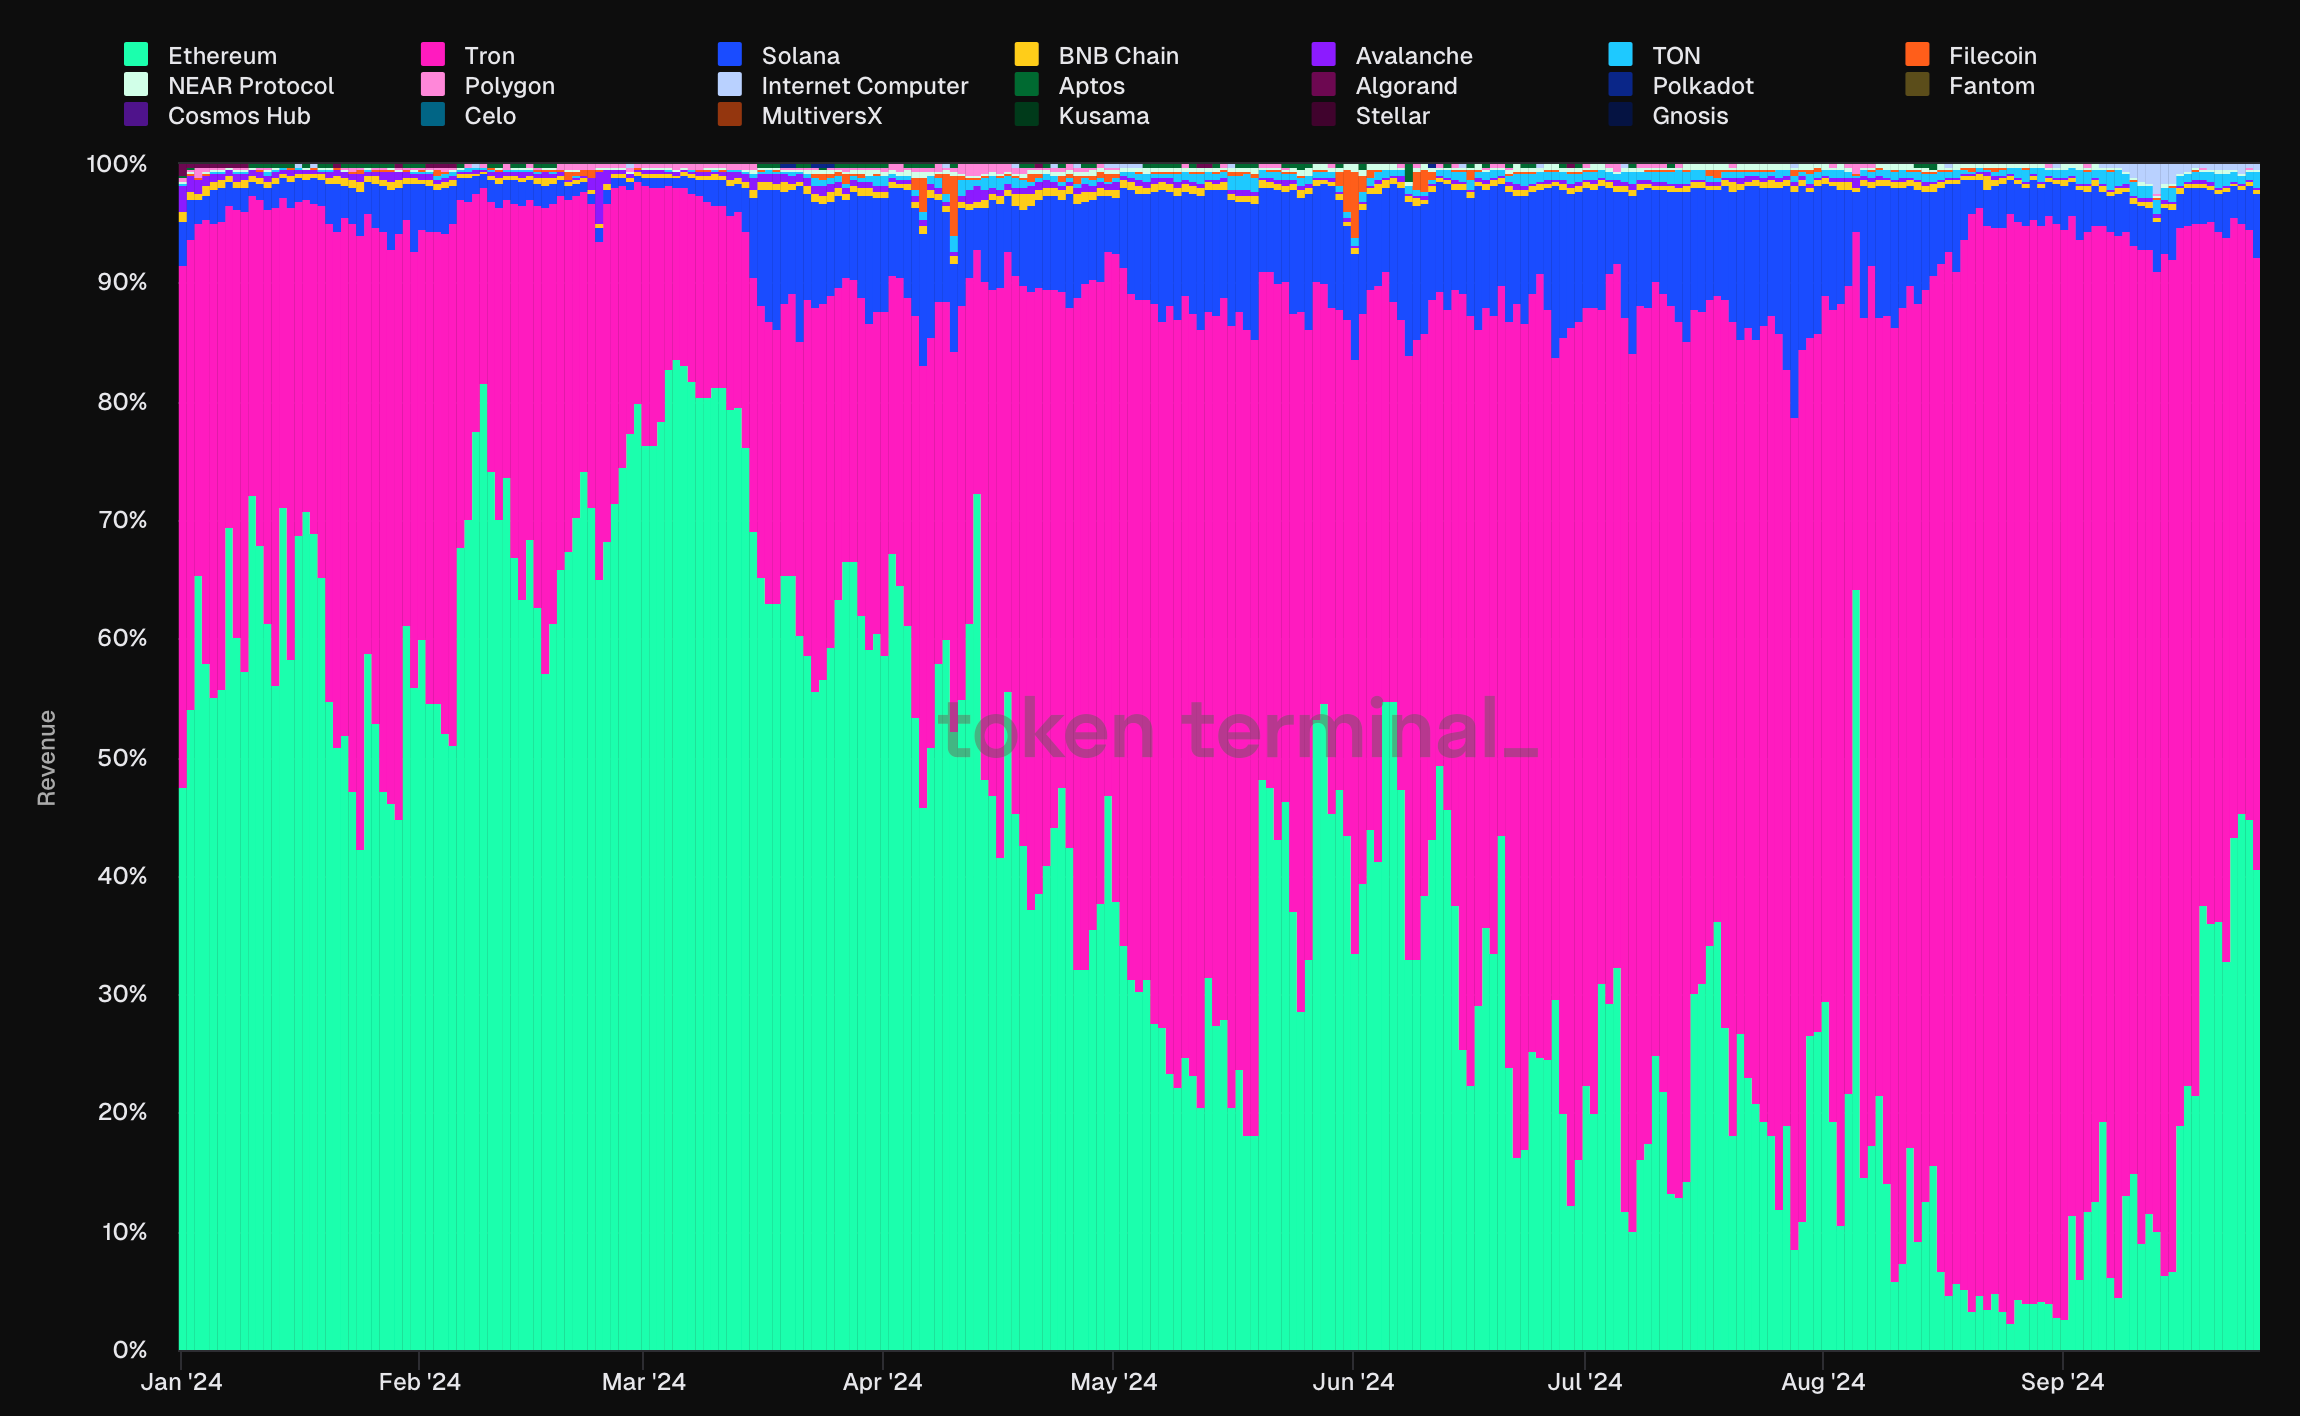
Quick insight: Tron, Solana, Ethereum, and TON now generate 98% of all L1 revenue.
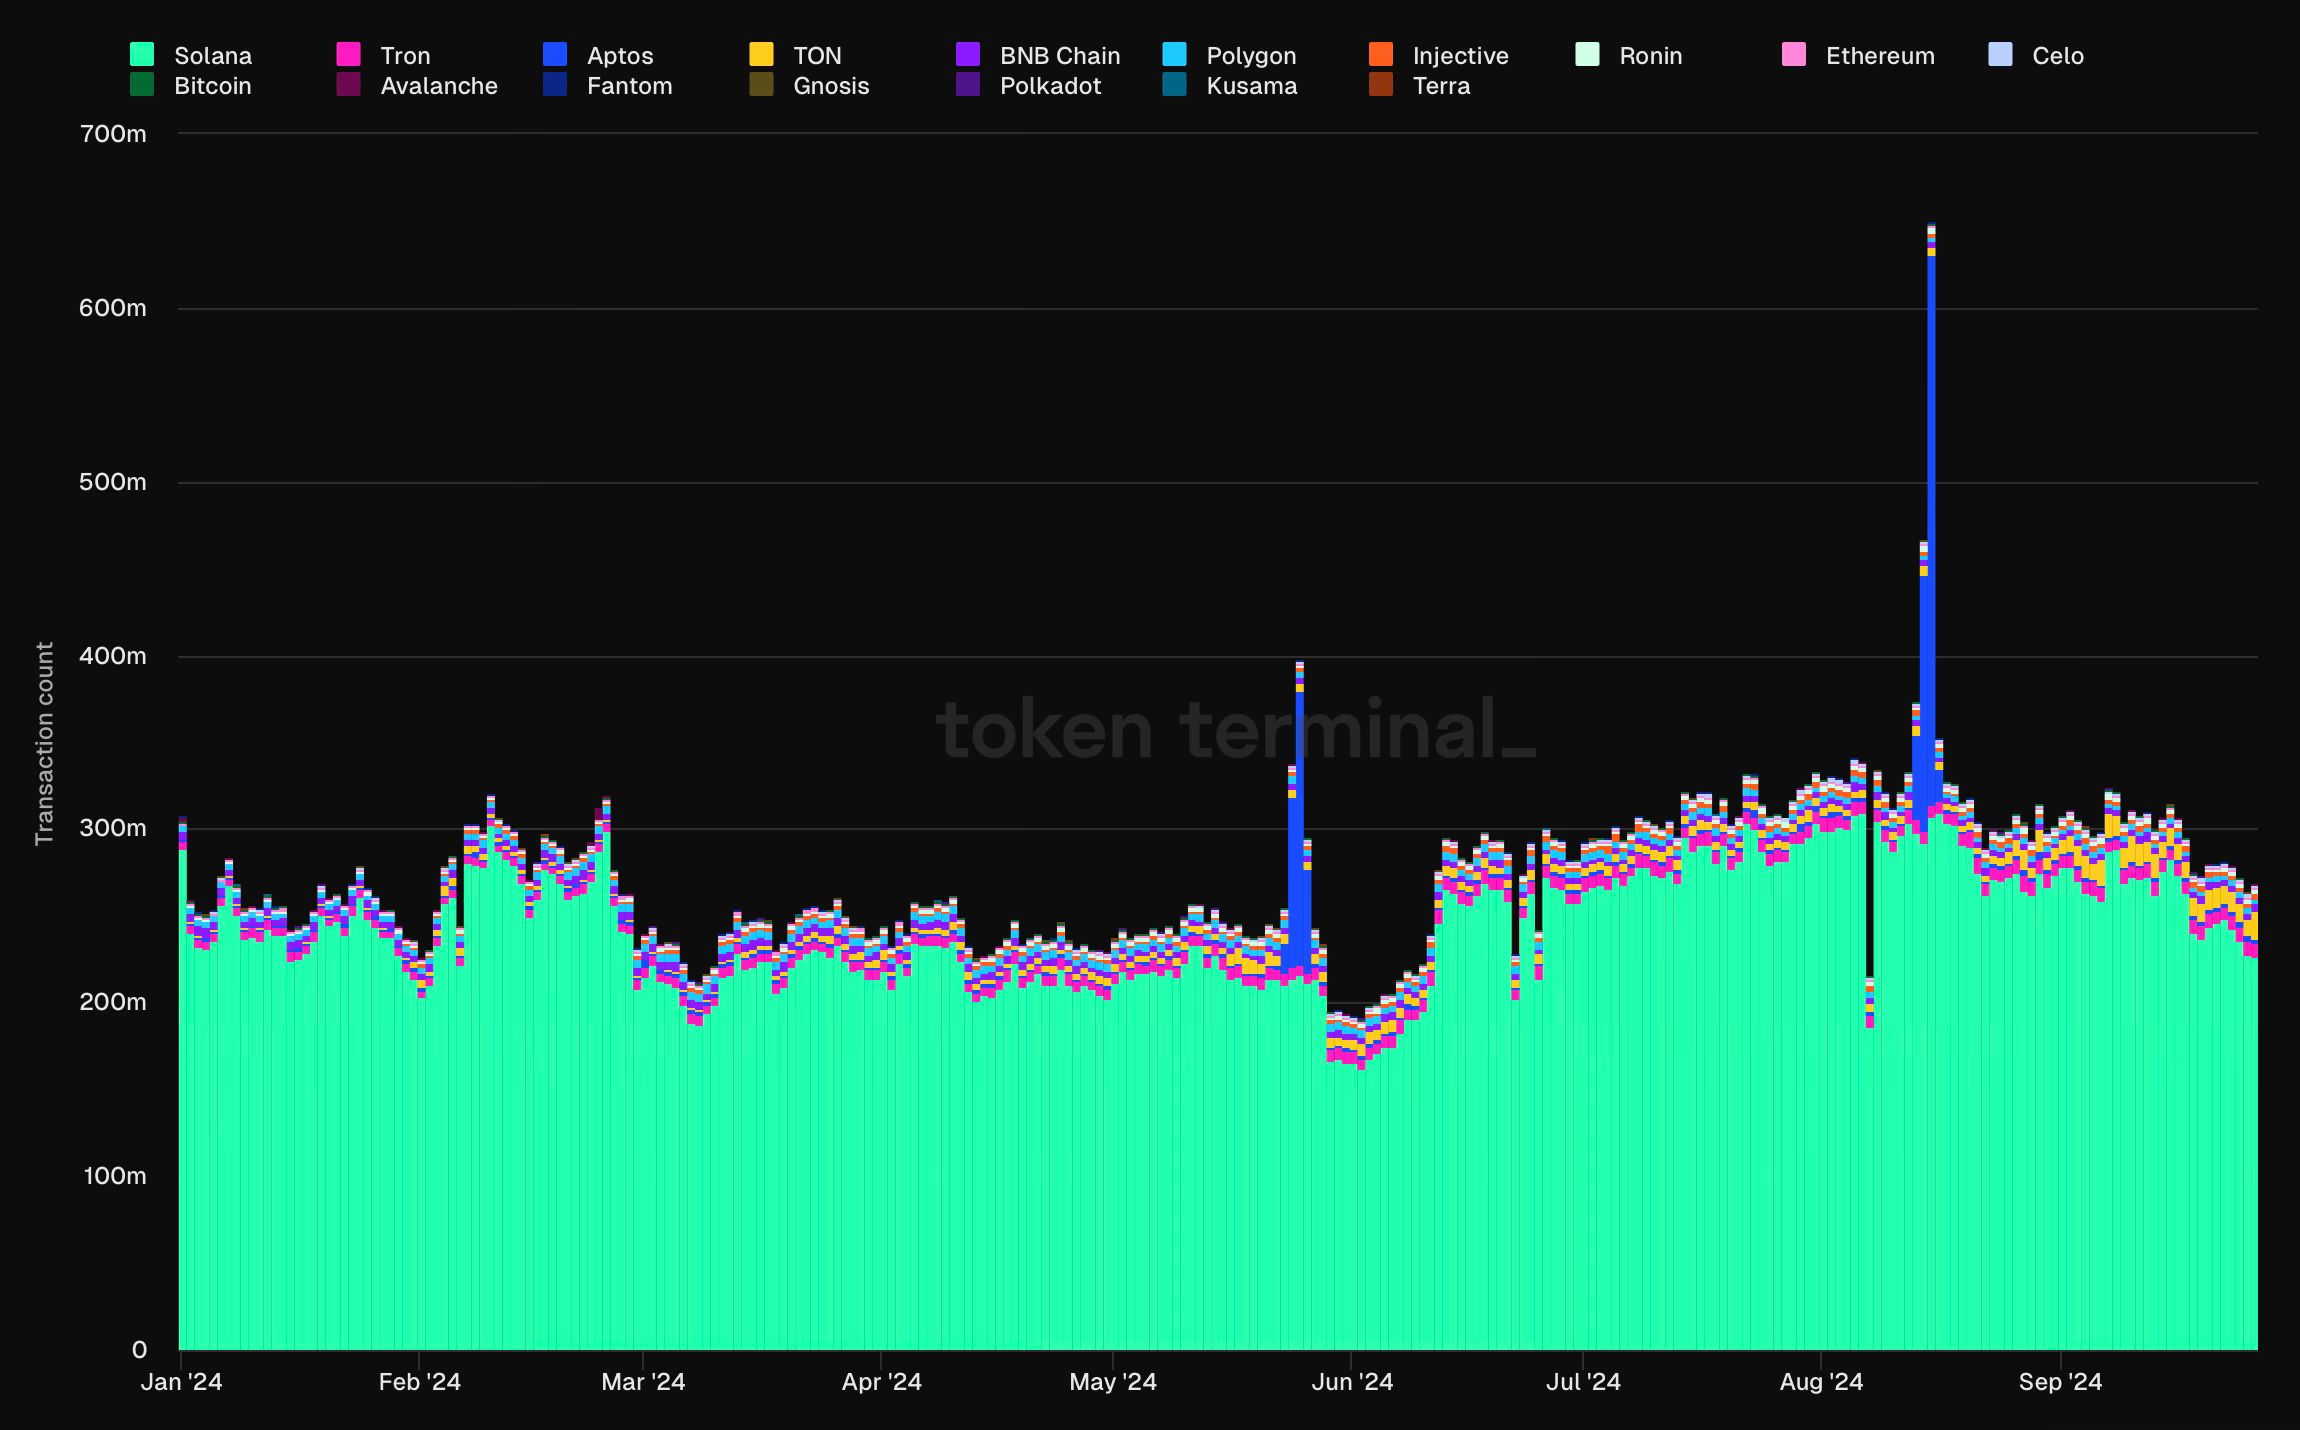
Transaction Activity
Throughout the year, transaction activity on L1 chains has remained relatively stable, with Aptos experiencing two significant activity spikes. However, there have been a few structural changes in the composition of this transaction activity.
TON and Tron have seen an increase in daily transactions since the beginning of the year. In contrast, Avalanche's metrics have dropped from 1.4 million to 180,000.
Quick Data Insights
This week, SUI trading volume has surpassed the trading volumes of NEAR, AVAX, and ATOM together.
TON now has 10 million more token holders than Bitcoin.
The average transaction fee on Bitcoin has decreased from $12 to $1.5 since the beginning of the year.
According to Token Terminal, Ethereum has the largest core developer community, followed by Cosmos and Internet Computer.
Code commit activity for the top 20 tracked chains has steadily declined since the beginning of the year.
The number of contracts deployed on TON has surged from 8.1K to 2M per day now.
By TPS, the top-3 chains tracked on Token Terminal are Internet Computer, Solana, and TON.
Gnosis has the highest P/F ratio (fully diluted) of 16,000x. Tron’s P/F ratio is the lowest – just 5.18x.
Solana and Sui saw large bridge inflows in Q3 2024. Aptos, BSC, Bitcoin, and Ethereum saw a steady decline in inflows.
Upcoming Events
To fully grasp the state of L1s and set realistic expectations, we need data on upcoming events that could act as catalysts for structural changes. Below are some of the most significant events, based on data from Messari Intel.
Ethereum: Pectra (Prague-Electra) Hard Fork
Solana: Solana Mobile Stack (Saga and Seeker) and the release of Firedancer Validator Client
Polygon: Polygon Miden mainnet and the AggLayer
Cosmos: Gaia v20.0.0 upgrade
Internet Computer: Chain Fusion
NEAR Protocol: Chain Abstraction Stack
Celo: L2 mainnet launch
Sonic Labs (ex. Fantom): Sonic mainnet launch and S token release
Simple and insightful